Sign in to your account, or register if this is your first visit.
Loading…
Maris Africa Fund II
Building on a 15-year Africa track record. Combining an experienced team, operational capability, regional footprint and extensive partner network to build valuable platforms and achieve high-return exits.
USD 150M
Target Fund Size
20-30%
Company Target Gross IRR
15% Fund Target Net IRR
2.0-3.0x
Company Target Gross MOIC
2.0x Fund Target MOIC
15+
Years Track Record
5,976
Jobs Created
Executive Summary
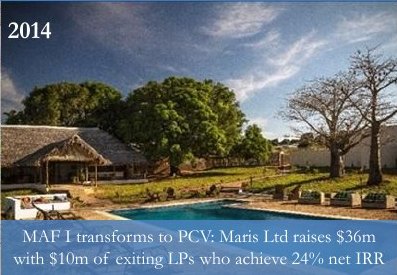
Maris Africa Fund II builds on the successful track record of Maris Ltd and the USD 26m Maris Africa Fund I (2009-14 vintage, 24% net USD IRR) to raise a correctly-scaled fund focused on East and Southern Africa.
Proven Track Record
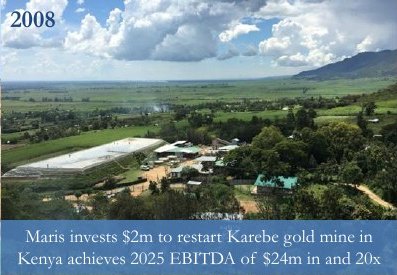
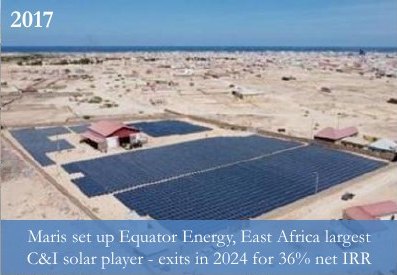
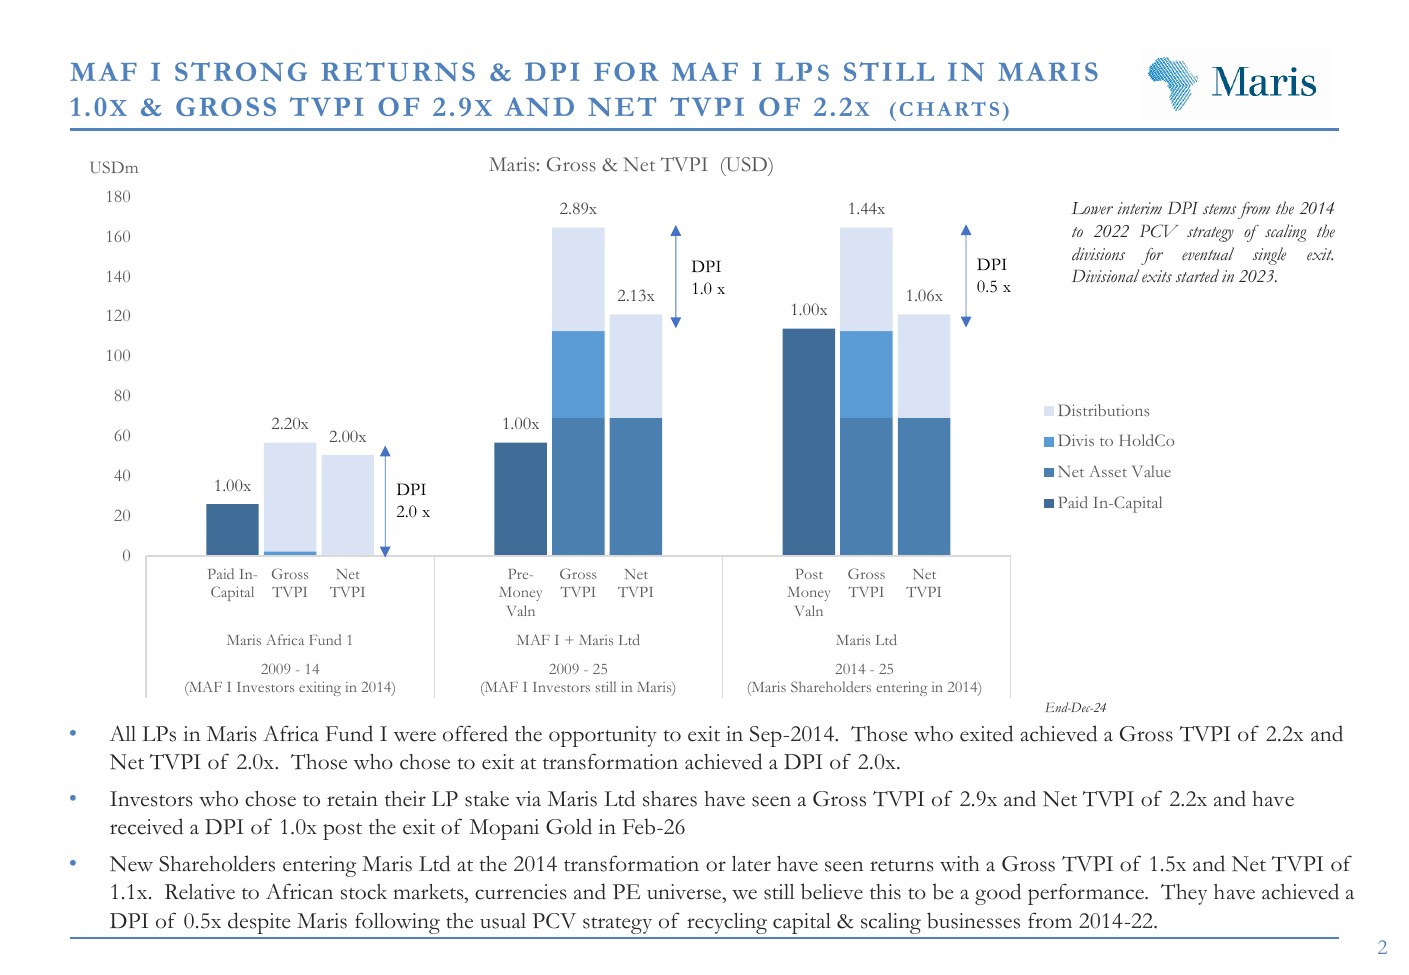
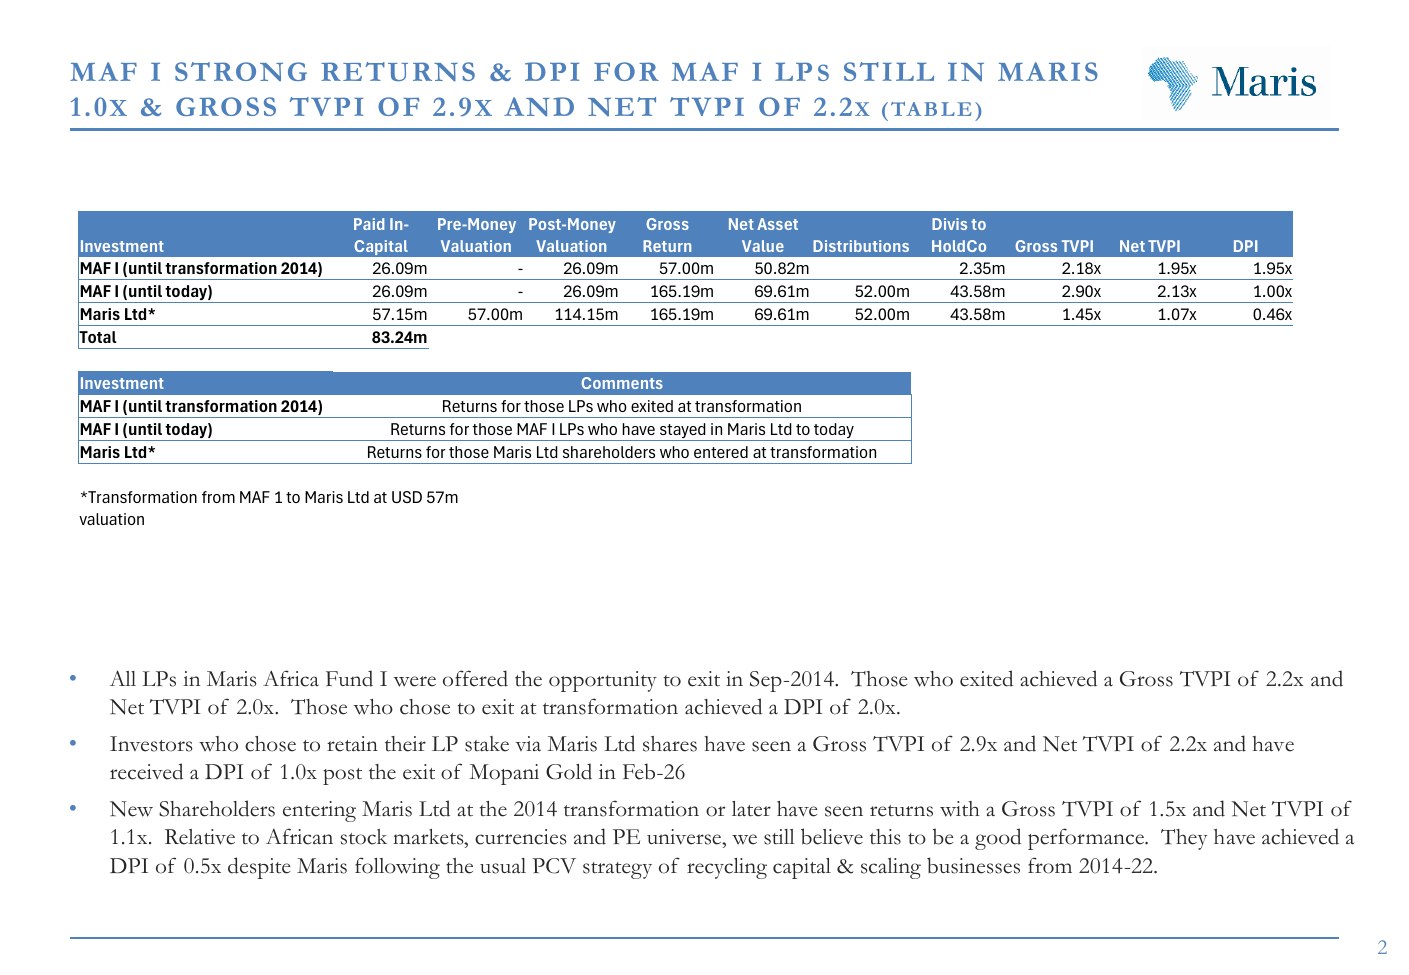
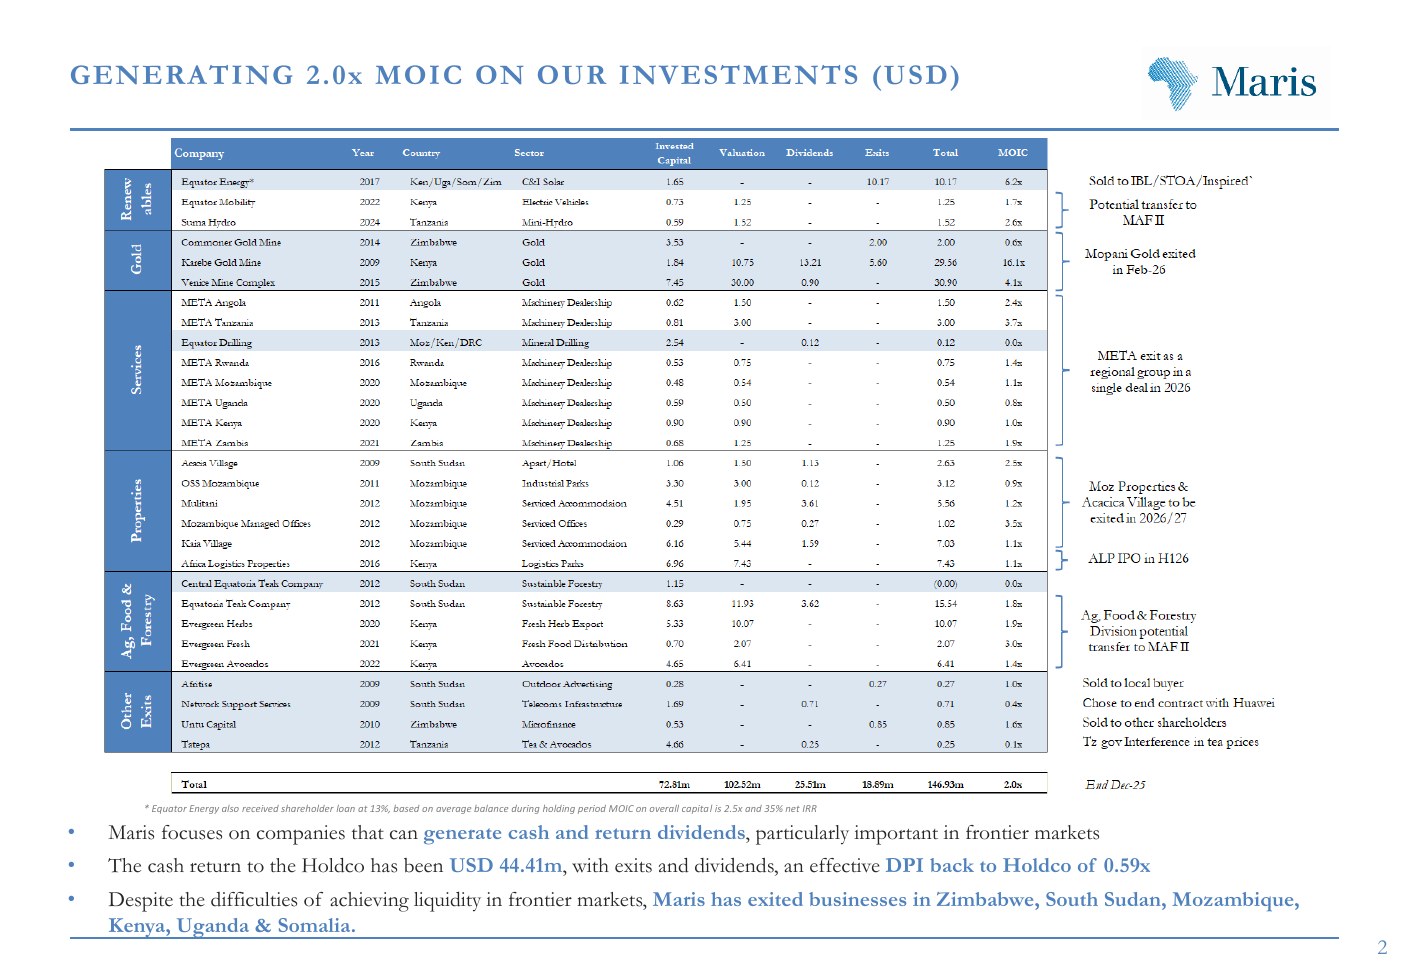
MAF I achieved a 24% net USD IRR and 2.2x net TVPI. Equator Energy exit delivered 36% net USD IRR. Karebe Gold has paid 8x in dividends and achieved 16x total MOIC in USD. Completed 25+ deals across 12 countries.
Operational Edge
Deep operating capabilities allow Maris to incubate, turn around, and scale companies. Platform building de-risks investments and supports exits to larger strategic buyers.
Impact & Returns
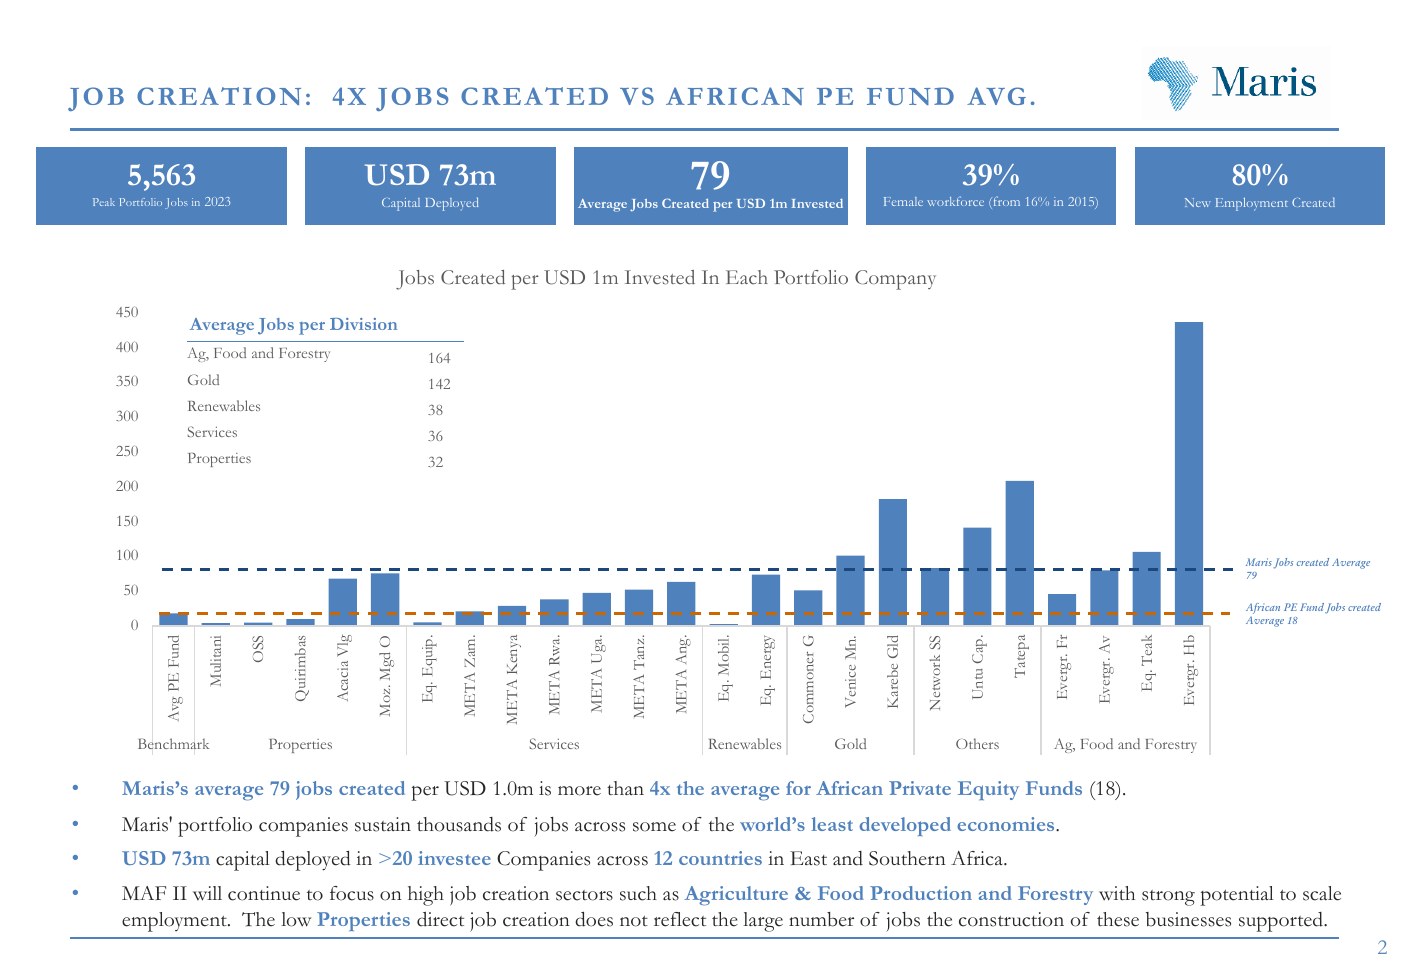
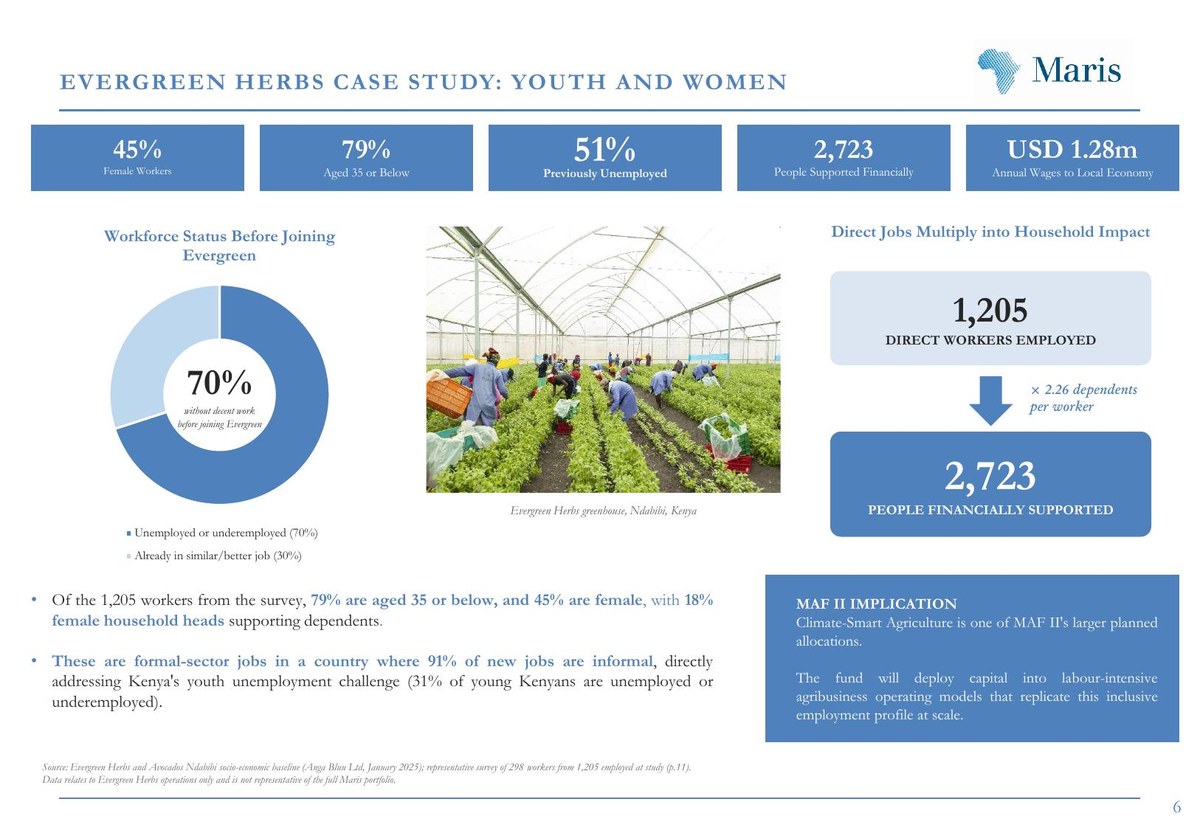
5,976 peak portfolio jobs in 2023, USD 73m capital deployed, 79 jobs per USD 1m invested (4x African PE average), 39% female workforce. Impact and returns are not mutually exclusive.
Currency Risk Management
USD-denominated fund focused on businesses with USD or USD-linked earnings, reducing currency risk in frontier markets. Hard-currency, asset-backed sectors are the strongest drivers of fund returns.
An Experienced Investor You Can Trust To Navigate Africa
15-year track record and deep in-house operating capabilities allow us to incubate, turn around, and scale businesses for exit to larger players. 25+ deals completed across 12 countries.
Ideally Positioned for High-Return Exits
Partner network and regional footprint enable us to build valuable platforms which de-risk investment. USD 207m capital mobilised across DFI co-investors, strategic JVs and family offices.
One of the Most Impactful PE Investors
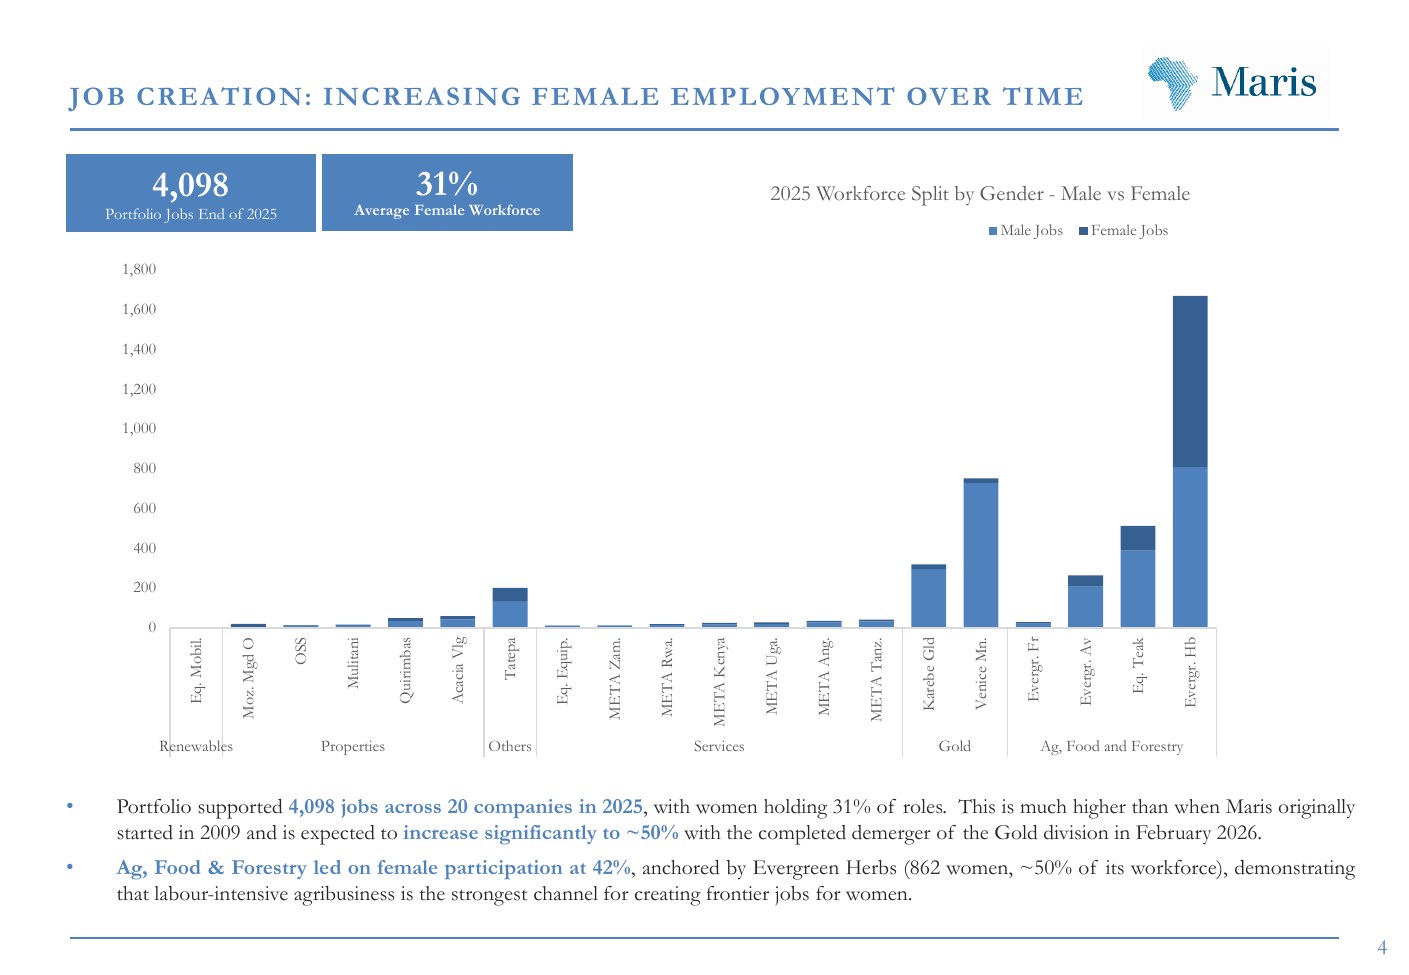
Job creation, social and environmental impact and high returns are not mutually exclusive. 5,976 peak jobs created, USD 43.8m in taxes, USD 101m in wages, 38% female workforce.
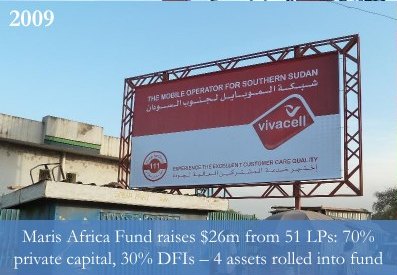
4 of the largest DFIs (BII, IFC, FMO, Proparco) have invested in or alongside Maris, as well as Oxford University Endowment Management. 70% of capital historically from non-DFI sources.
Industry & JV Partners
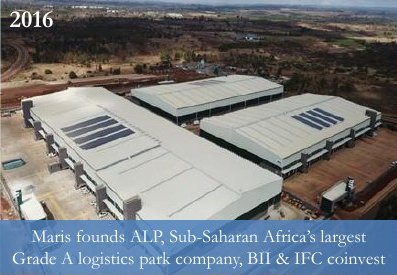
Industry partners see Maris not only as a reliable dealer or distributor but as a JV partner to set up and jointly run operations in Africa. Maris seeded and founded ALP, SSA's No.1 logistics park company.
Capital Mobilisation
USD 207m raised across DFI co-investors, strategic corporate JV partners, family offices and Kenyan pension capital. Mobilisation for MAF II target sectors was 3x the Maris capital deployed.
Governance & Reporting
Board & Structure
Advisory Board primarily composed of LP representatives. Investment Committee: Maris Partners plus 1-2 external members. Fund Administration, Audit, Legal and Tax in Mauritius.
4 of the largest DFIs (BII, IFC, FMO, Proparco) plus Oxford University Endowment Management. 70% of capital historically from non-DFI sources, including family offices and Kenyan pension capital.
Key Terms
Feature
Target
Fund Size
USD 150m
Deal Size
USD 5m to USD 20m
Target LPs
DFIs, Family Offices, Impact Funds, Fund of Funds, Climate-focused Investors, HNWI
Profile
Build and invest in businesses in sector regions. Platforms for exit (direct equity and quasi-equity).
Sectors
Renewables, E-Mobility, Climate-Smart Agriculture, Forestry, Finance, Digital Infrastructure
Geographies
Africa (East & Southern Africa focus)
Currency
USD Denominated, focused on USD and USD-linked revenues
Fees
2.0% Management Fee and 20% Carry
Fund Life
10 years + 1 + 1
Close Date
Q4 2026 (1st Close), Q4 2027 (Final Close)
Deployment
10-12 investments to build 5-6 platforms
Company Returns Target
20-30% gross IRR, 15-25% net IRR, 2.0x-3.0x gross ROI
Fund Return Target
15% Net IRR, 2.0x MOIC
Exit Options
Industry Strategics, Regional and Local Groups, PE Funds, Local Pension Funds, MBO, IPO
Confidential & Privileged. This portal and all materials herein are provided for informational purposes only and do not constitute an offer to sell or a solicitation of an offer to buy any securities. Past performance is not indicative of future results. All investments involve risk, including the possible loss of principal. Information is confidential, intended solely for qualified investors under NDA, and may not be reproduced or distributed without prior written consent of Maris Africa Ltd.
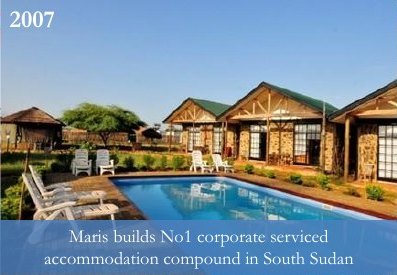
Twenty-nine portfolio companies built across eleven East and Southern African markets since 2009. Drag the slider or hit Play to watch the platform unfold from 2009 to 2025.
2009Founding year - Kenya and South Sudan platforms launched
Not entered
New entry
Maris country
3Investments to date
Countries entered
0
Investments to date
0
Cumulative capital (USD m)
0.0
Sectors
0
Investment History
Confidential. Investment data sourced from Maris Africa Fund II appendix materials.
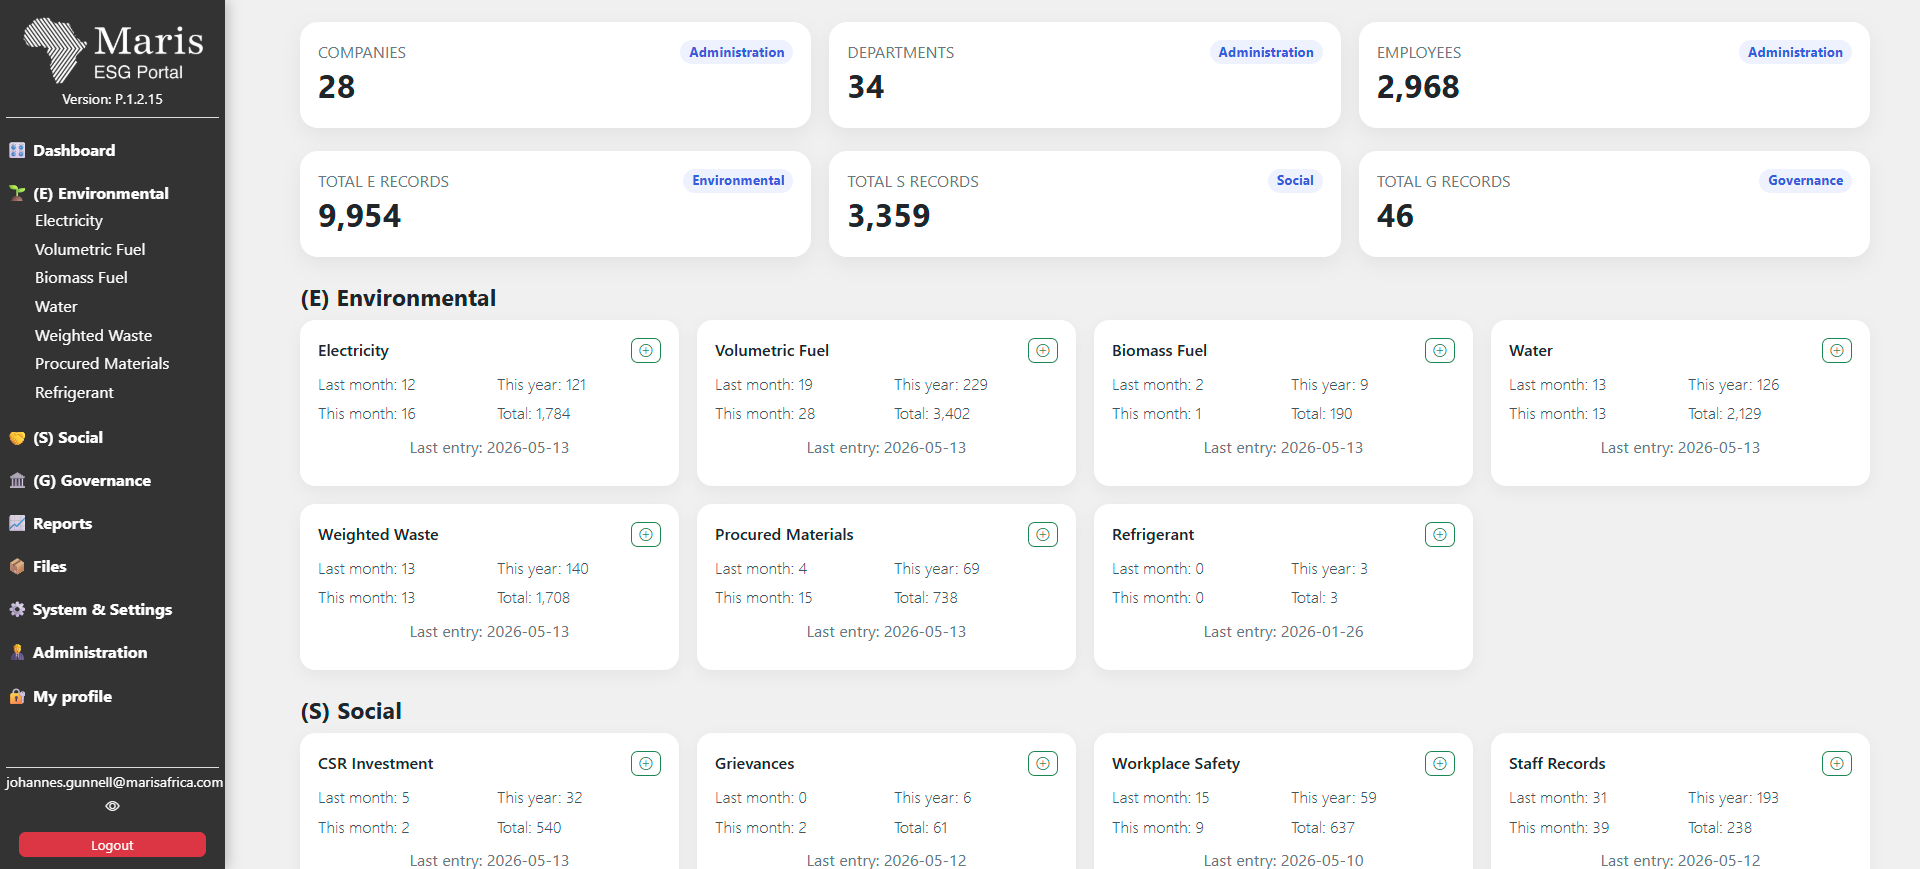
Maris operates an integrated Environmental, Social and Governance management system across all portfolio companies. Two views are available: the live ESG Portal where companies file evidence and report KPIs, and a Power BI dashboard summarising group-level ESG metrics.
5,976
Peak portfolio jobs
39%
Female workforce
37%
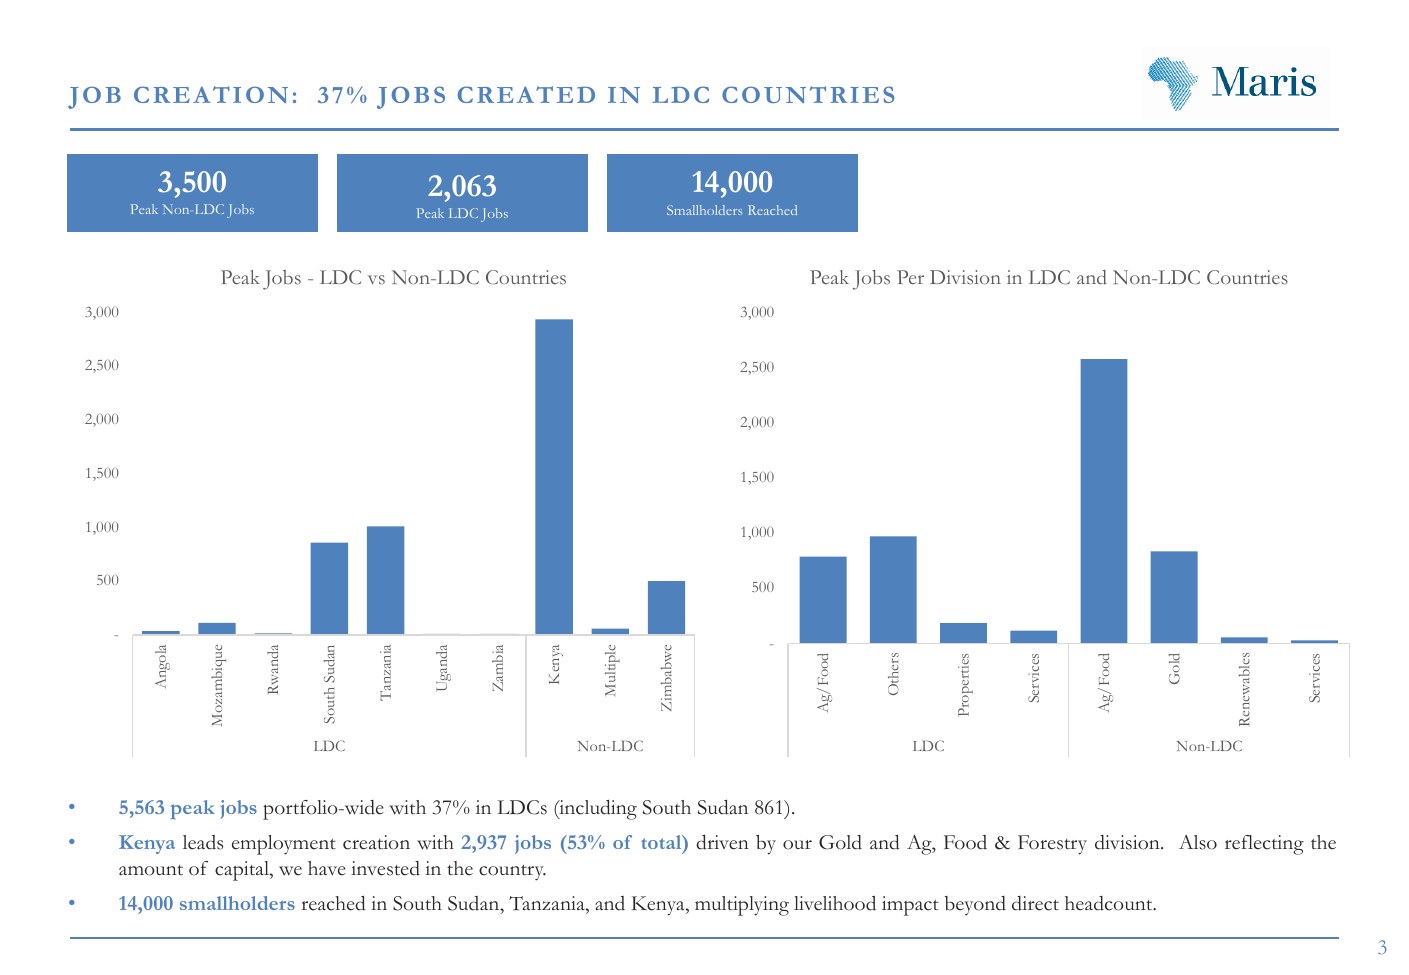
Jobs in LDCs
14,000
Smallholders reached
USD 56m
Taxes and royalties paid
Framework alignment
IFC Performance Standards
All portfolio companies categorised and managed against IFC PS1 to PS8.
2X Challenge
Gender-lens screening across deployment and portfolio management.
IRIS+ metrics
Standardised impact KPIs reported quarterly to investors.
The Maris ESG Portal hosts the live management system used across the group, where portfolio companies log incidents, evidence, training records, KPI returns and audit trails. Click the dashboard below to open esg.marisafrica.com/dashboard.php in a new tab. Access is issued per investor on request.
Ten years of audited Environmental and Social reporting, alongside the live ESG portal. Click any cover to open the PDF, or visit the central Documents library for the full set.
Group-level ESG metrics, embedded live from Power BI.
Three views drawn from the Maris job creation analysis (Appendix 4). Click any slide to download the full PDF.
A real-time view of opportunities under active assessment by the Maris Africa Fund II investment team. All companies are presented under project code names; data are sourced from the team's live screening workbench.
-
Active opportunities
-
Aggregate ask (USD)
-
Advance verdict
Strong mandate fit
Investment Thesis
MAF II targets a 35 / 35 / 30 capital deployment split across three thesis pillars. Every opportunity in the pipeline is mapped to one of these buckets to ensure thesis discipline and portfolio balance.
Anchored by Maris's Evergreen and ETC platforms. Includes:
Export horticulture, herbs, avocado, fresh produceForestry and nature-based solutions, teak, carbon, reforestationAg and food processing, distribution, value-add, aquaculture, agritech
30%
Target deployment
Generalist
Diversification across selected USD-earning sectors:
Finance, banks, NBFIs, leasing, fintech, microfinanceDigital infrastructure, data centres, fibre, towers, BPO platformsUSD-linked services, hospitality, real estate, healthcare, industrial
Target geography: East and Southern Africa, consistent growers (Kenya, Tanzania, Rwanda, Uganda, Ethiopia) and recent accelerators (Zimbabwe, Mozambique, DRC), with selective post-conflict exposure where Maris has on-the-ground operating capability.
The Maris Opportunity Screener
Every opportunity is evaluated through Maris's proprietary 11-criterion screening framework before any capital commitment is contemplated.
Eleven assessment criteria
1. Sector and thematic fitAlignment with the three MAF II pillars: Decarbonisation, Climate Smart Agriculture, Generalist.
2. Platform and scalabilityRegional scalability potential and ability to build a multi-country platform.
3. Control and operational influenceAbility to obtain governance rights, install playbooks, and influence operations.
4. Exit-abilityVisibility of credible exit pathways: strategic acquirers, regional PE buyers, IPO venues.
5. Geographical alignmentFit with Maris's core East and Southern Africa focus.
6. USD or USD-linked earningsHard-currency exposure and pricing-power resilience to local FX.
7. Market growthUnderlying market CAGR and addressable TAM.
8. Management quality and governanceTrack record, team depth, alignment, reporting discipline.
9. Impact and SDG alignmentQuantifiable jobs, gender, climate and broader SDG contributions.
10. ValuationEntry pricing discipline vs. peer comparables and target IRR.
11. Risk profile and mitigationIdentification and mitigation of FX, regulatory, ESG and operational risks.
Verdict bands
Each opportunity is scored across the 11 criteria, weighted, and converted to a percentage that maps to one of three verdict bands:
Advance
We are taking a closer look. This is not a commitment to full due diligence; it indicates an NDA has been signed and we are reviewing further information from the sponsor.
Hold
We have requested clarification on specific items, and will rescore the opportunity once the additional information is provided.
Discard
The opportunity falls outside the mandate, or quality and fit are insufficient. Sponsor has been politely declined.
Pipeline by Investment Thesis
Use the tabs to filter the geography map and the deal scoreboard by thesis. Click any deal row for the one-pager; click any country count for a thesis-by-country breakdown.
Verdict split
Stage mix
Pipeline geography
Active-book opportunities by country. Country shading scales with deal count; hover the map for the country name, click a number in the table for the thesis breakdown.
Country
Count
Proprietary Deal Sourcing
Alongside broker-introduced and direct-contact opportunities, the Maris investment team maintains a proprietary market map sourced through bottoms-up sector and geography research. This widens the funnel substantially and lets us approach the strongest candidates before they reach the open market.
Market-mapped
—
opportunities under research
Advance verdicts
—
—% of total — passed Phase 1 screen
Outreach started
—
elevated past initial screening
Countries researched
—
across East & Southern Africa
Distribution by thesis
Top countries (deals researched)
Proven funnel. Two market-map opportunities — Project Verde (Agris food & agribusiness platform) and Project Canopy (forestry platform) — have already been elevated to the active book as Maris Ltd platform transfers, demonstrating that proprietary research surfaces real, executable deals.
Deal scoreboard
Sorted Advance, then Hold, then Discard; tie-broken by Phase 1 score. Click any column to re-sort, click any row for the one-pager.
60+ years of combined experience working together. Balanced team across Nairobi, Maputo, and London.
AD
Assucena Daude
Finance Manager, Mozambique
Assucena Daude
Finance Manager, Mozambique
Assucena worked as an Administrator at Mozambique Managed Offices before moving to Maris Mozambique in 2016 to join the accounting team.
She holds a Bachelor of Accounting Degree from the University of Sao Tomas.
JG
Johannes Gunnell
Managing Partner
Johannes Gunnell
Managing Partner
Johannes joined Maris in 2010 following seven years in Global Equities at UBS Investment Bank, with a particular focus on Green and Socially Responsible Investments.
He was a Partner at Maris Capital and previously the Commercial Director for Maris, responsible for new investments, acquisitions and disposals. He has sat on numerous boards, including publicly listed companies in Tanzania and Pakistan.
Johannes holds an MA in Politics, Philosophy and Economics from Oxford University.
JK
Joyce Kipruto
ESG Manager
Joyce Kipruto
ESG Manager
Joyce monitors and oversees the implementation of the Group’s ESG initiatives across operations, ensuring alignment with the Environmental and Social Management System. She is also responsible for reporting on the progress of these initiatives to stakeholders.
Joyce joined Maris in 2022 as an ESG Data Analyst and holds a Bachelor’s degree in Environmental Planning and Management from Kenyatta University.
SM
Salome Maina
Office Manager
Salome Maina
Office Manager
Sally was Maris's first employee, joining Maris Kenya in 2012 with a Diploma in Business Administration and Public Relations / Journalism.
In addition to general administration, Sally provides support for logistics and procurement across the group.
HM
Harry Minter
Partner
Harry Minter
Partner
Harry joined Maris in 2012 and spent the last 10 years managing businesses in East Africa. He started up three portfolio companies and orchestrated the exit of Equator Energy.
He now heads up the Renewables Division and focuses on climate-related pipeline. Prior to joining Maris, he worked for a hedge fund group in London.
Harry holds a law degree from Edinburgh University, Level 3 IMC certificates, and an MBA with distinction from Warwick Business School.
BM
Bryan Mukiri
Associate
Bryan Mukiri
Associate
Bryan leads investment screening, financial analysis, and valuation, while supporting deal origination, due diligence, and portfolio monitoring across the firm’s holdings.
He brings four years of experience in corporate finance, financial advisory, and M&A across Africa, previously at a boutique M&A and capital raising firm based in Nairobi, Kenya, where he contributed to more than USD 100m in transactions spanning real estate, manufacturing, agriculture, and financial services.
Bryan holds the FMVA designation and is a Certified Public Accountant (ICPAK). He earned a BSc (Hons) in Finance and has completed executive programmes in financial markets and sustainable development.
IM
Ian Musyoka
Associate
Ian Musyoka
Associate
Ian is a seasoned finance and accounting professional with over seven years of experience in financial reporting, tax compliance, budgeting, and audit.
As the Group Accountant at Maris Kenya, Ian provides critical financial analysis and support to the company and diverse portfolio of subsidiaries, spanning sectors such as renewable energy, services, and agriculture.
Ian holds a bachelor’s degree in finance and accounting from Strathmore University and is a Certified Public Accountant (CPA-K).
RN
Rosemary Ngure
Operating Partner & Head of ESG
Rosemary Ngure
Operating Partner & Head of ESG
Rosemary brings over 20 years' experience across ESG and sustainable investment, corporate governance, and legal and regulatory compliance.
She previously led ESG and impact management at Catalyst Principal Partners, a US$275m DFI-backed private equity platform, where she also served as Secretary to the Investment Committee, Senior Advisors Committee and Investor Advisory Board.
EN
Eva Nightingale
Country Manager, Mozambique
Eva Nightingale
Country Manager, Mozambique
Eva joined Kaia Village (Quirimbas Support Services) in 2015 from a high-end events catering company in the UK, which she founded and managed.
She has professional experience in the public sector and has run a UK-registered NGO focused on health and education in rural communities.
JO
Janet Onyango
Head of Finance
Janet Onyango
Head of Finance
Janet joined Maris in 2019 and is regional finance director for East Africa.
She has over 15 years’ experience in financial accounting, planning, reporting, analysis and controls. She has worked across East Africa and the Middle East in a variety of sectors including FMCG, Healthcare, Manufacturing, Industrials and Audit assurance for both private and publicly listed companies.
Janet holds an MBA in Strategic Management and is a Certified Public Accountant of Kenya.
CT
Charlie Tryon
Founding Partner
Charlie Tryon
Founding Partner
Charlie co-founded Maris in 2009 and is a Director and Chief Executive of Maris Limited. He oversees the group from East Africa.
Prior to establishing Maris, Charlie developed a successful portfolio of venture businesses in Afghanistan and East Africa. He has started up and sat on the board of a wide range of businesses, and is currently Chairman of Africa Logistics Properties.
Previously, Charlie worked for Societe Generale in the investment banking division in London after graduating from the University of Edinburgh.
HV
Helen Vincent
Board Secretary & Executive Administrator
Helen Vincent
Board Secretary & Executive Administrator
Helen spent a decade at Africa Matters Limited with Baroness Lynda Chalker, gaining a wealth of experience working with governments across the African continent.
While at AML she was Personal Assistant to the Board and Event Manager, leading event collaboration with trade and industry bodies, including the Global African Investment Summit and the Nigerian and Ugandan Presidential Roundtables.
Helen holds a BSc in Geography from Portsmouth University, with a geographic focus on South Africa and Mozambique.
LW
Levi Wayua
Associate
Levi Wayua
Associate
Levi leads market research, investment screening, and data analytics for the Group.
He brings prior experience in commercial research and project management, with strong capabilities in dashboard design, GIS mapping, and data interpretation.
Levi holds a BCom in Marketing and certifications in Data Science, Humanitarian Data Analysis, and Research Methods, with experience across the renewables, humanitarian, health, FMCG, technology, and agriculture sectors.
Every deal follows the same six stages, from first contact to exit. A deal only moves forward once the previous stage is complete and documented, and two approval gates (the Preliminary and Final Investment Review) must be passed before any capital is committed.
Staged Approvals
Two formal approval points sit between first contact and committed capital: the Preliminary Investment Review and the Final Investment Review. Neither can be skipped.
Focus
We only pursue deals that fit the fund's investment theses and geographic focus. Deals that don't fit are declined early, before they consume time and cost.
E&S From the Start
Environmental and social review starts at screening, not at the end, and follows the same DFI standards our co-investors apply.
Everything Documented
Checklists, risk registers and Q&A logs are maintained for every active deal, so there is a clear record of what was found and why each decision was taken.
The Deal Lifecycle: Six Stages
The stage names below match the deal statuses shown on the MAF II Pipeline page.
1
Origination · Deal List
Sourcing & Origination
Most deals come from our own network, built over 15 years of operating across the region, alongside our own research into target sectors and referrals from long-standing partners. Every opportunity is logged with its source, sector, country and indicative size.
We generate our own deal flow rather than competing in auctions
First check: does it fit the fund's theses and geography?
Early background checks on the people involved
2
Screening
Screening & Preliminary Review
Deals that pass the first check are scored against the same criteria: the quality of the business, the strength of its management, fit with the fund, the terms on offer, and an initial E&S risk category. The best are written up as a Preliminary Investment Review (PIR), the internal case for committing time and money to full due diligence.
Every deal scored the same way, so the pipeline can be compared side by side
Desk review of the numbers, the market and the proposed structure
Initial E&S risk categorisation
Gate: PIR approval is required before full due diligence begins.
3
Due Diligence
Full Due Diligence
Due diligence runs to a set checklist: a formal document request list, a Q&A log with management, and a risk register kept up to date throughout. Outside advisers are brought in where specialist input is needed.
Commercial, financial, legal, tax and technical work
Management, governance and background checks
E&S due diligence to DFI standards, with an action plan (ESAP) where fixes are needed
Site visits and reference calls on every deal
Discipline: every material risk must be resolved, priced into the deal, or covered in the contracts before we proceed.
4
Investment Committee
Final Investment Review & IC Approval
The findings are brought together in a Final Investment Review (FIR): the investment case, valuation and structure, the risks and how each is dealt with, E&S findings, and the plan for the first years of ownership. The Investment Committee then approves, declines, or sends the deal back with conditions.
FIR memorandum covering all diligence findings
Valuation, structure and downside cases
Any conditions of approval tracked until they are met
Gate: Investment Committee approval is required before any binding commitment.
5
Execution
Legal Completion
What we found in diligence is written into the contracts: warranties, conditions that must be met before money moves, board and governance rights, and any E&S undertakings. Completion happens only once every condition is satisfied.
Diligence findings converted into contractual protections
Board representation, reserved matters and information rights
ESAP obligations written into the legal documents where relevant
6
Post-Investment & Exit
Value Creation, Monitoring & Exit
Each investment starts with a 100-day plan agreed with management. From then on, companies report monthly against their KPIs, we take an active role on the board, and E&S progress is tracked. We think about the exit from day one and review the options regularly.
100-day plan covering governance, reporting and early wins
Monthly financial and operating reports to Maris
ESAP implementation tracked to completion
Exit options reviewed regularly, not left to the end
Diligence Workstreams
Full due diligence is split into parallel workstreams, each with its own checklist and owner. Outside advisers supplement the team where specialist expertise is needed.
Commercial
Market size, competition, customer concentration, pricing, and whether the growth assumptions behind the plan stand up.
Financial
Quality of earnings, working capital, debt and hidden liabilities, the historical accounts, and how much weight the forecasts can bear.
Legal & Tax
Corporate structure, ownership of key assets, material contracts, licences and permits, litigation, and tax exposure in each country.
Management & Integrity
The team's track record, background and sanctions checks on shareholders and counterparties, and how the business is actually governed.
Environmental & Social
E&S review to DFI standards: a risk category, gaps against the applicable standards, and a time-bound action plan where fixes are needed.
Technical & Operational
The state and capacity of the operating assets, systems and supply chain, and whether the operating assumptions hold in practice.
Decision Gates at a Glance
Each stage ends with a defined gate and a documented output.
This page summarises the Maris investment process for investor information. It is not an offer or investment advice, and it is not a complete description of the process, which is governed by the Fund's constitutive documents and internal procedures. Confidential. For the intended recipient only.
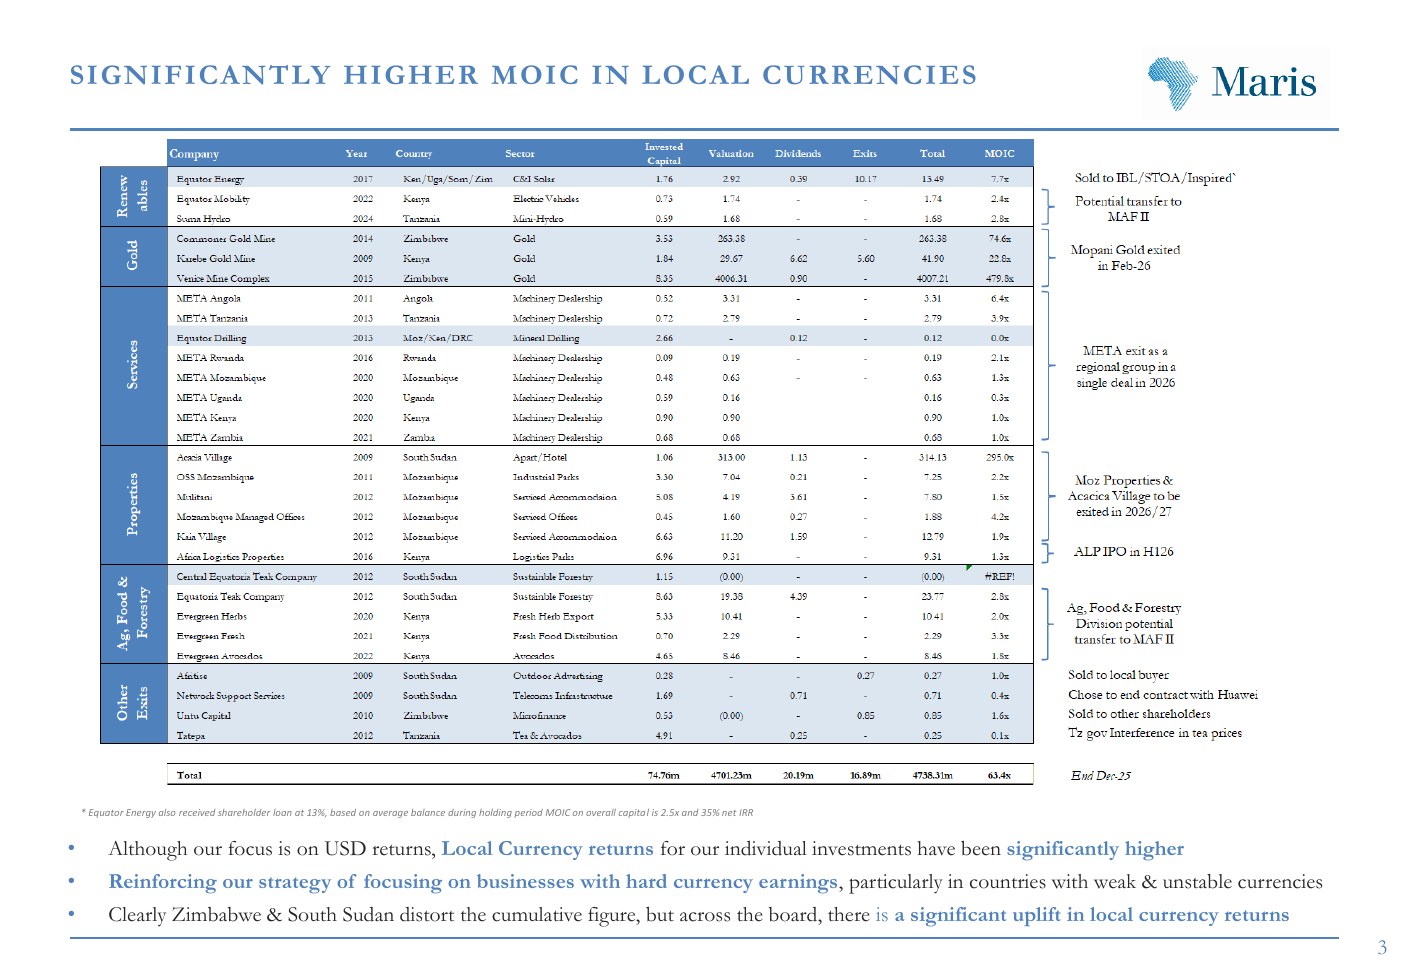
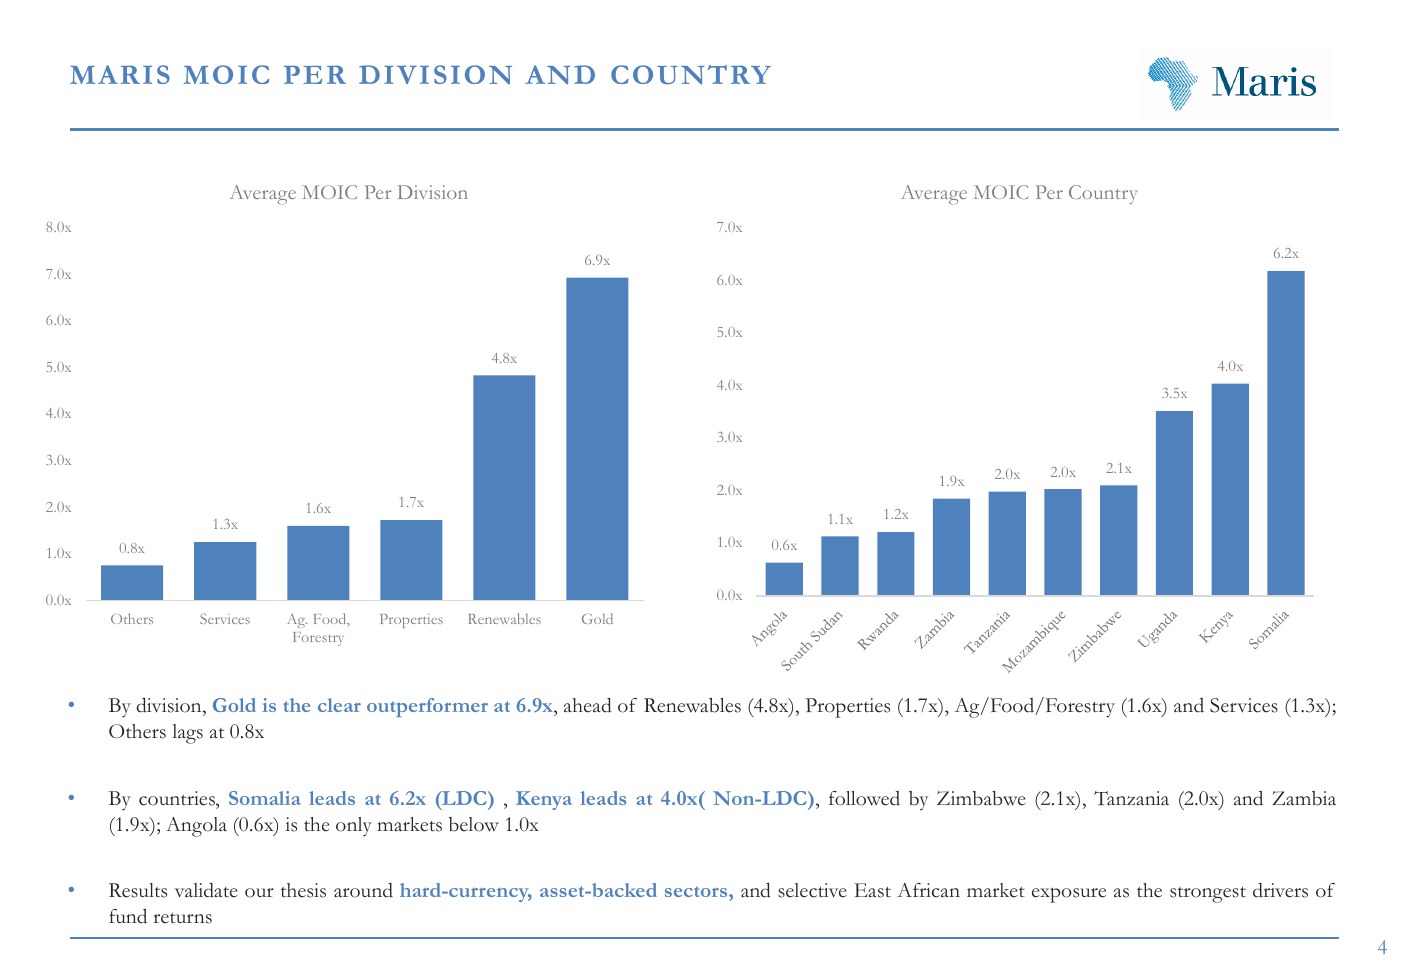
Track record performance metrics across Maris Africa Fund I and Maris Ltd investments. Click any slide below to open the full Investor Returns appendix.
24%
MAF I Net IRR (USD)
2.9x
MAF I Gross TVPI
36%
Equator Energy Net IRR
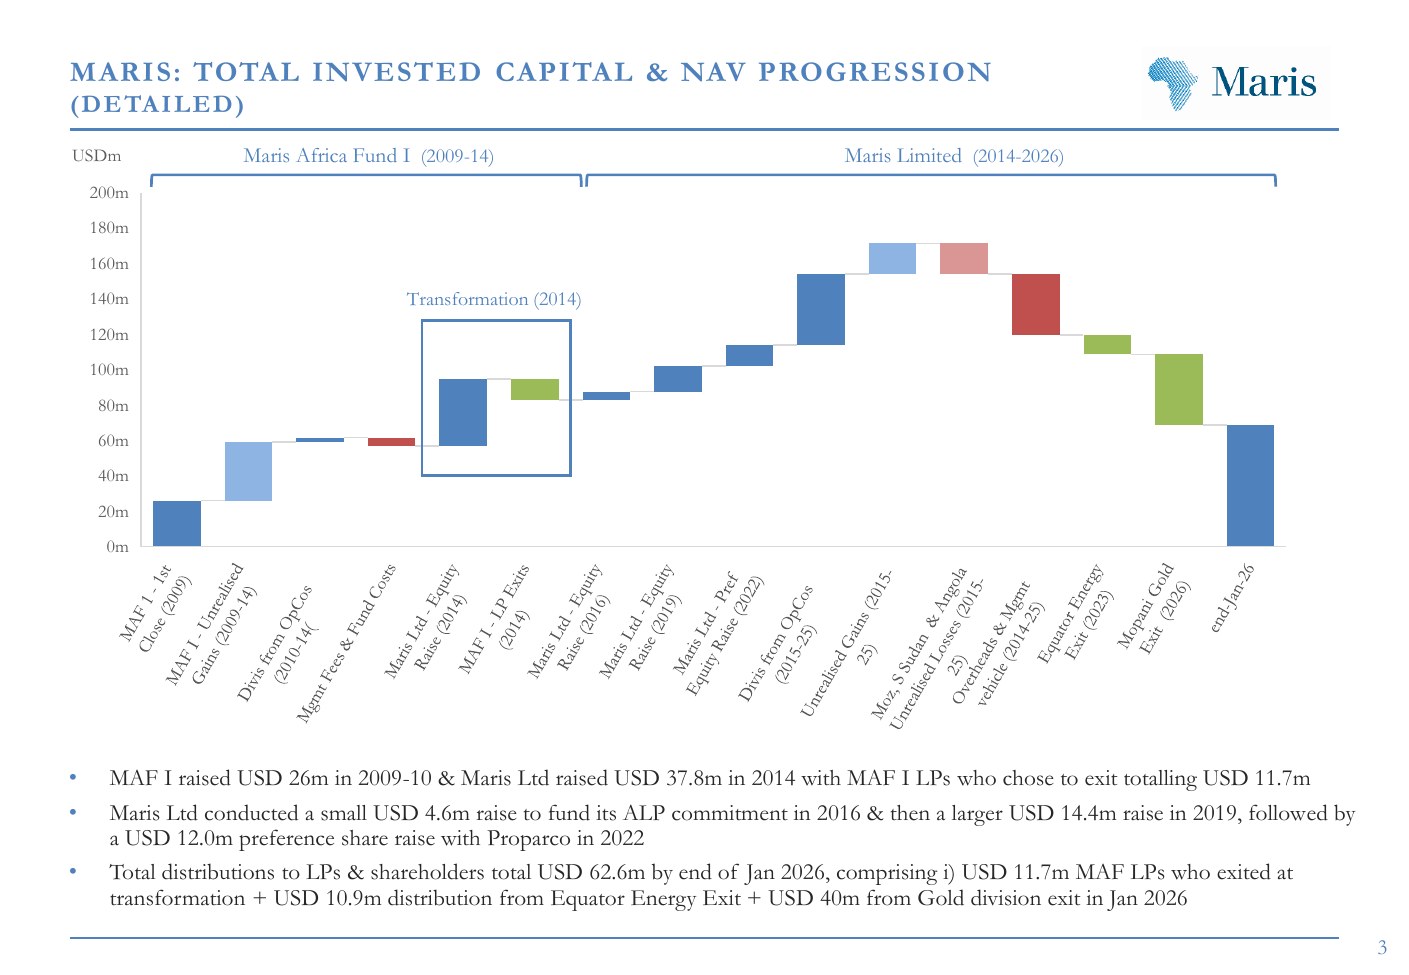
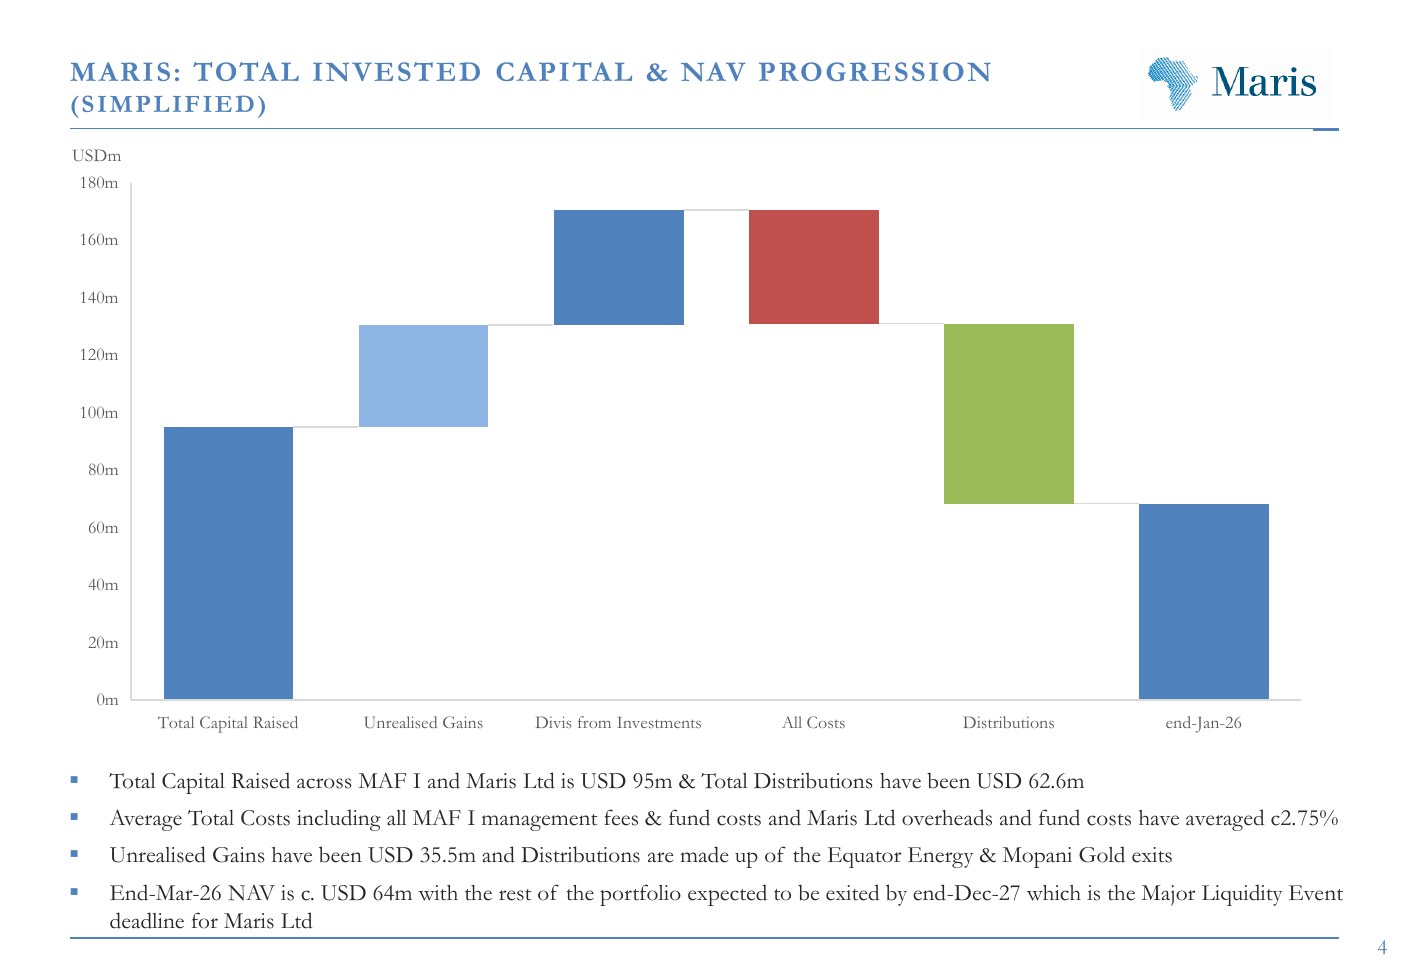
USD 95m
Total Capital Raised
USD 62.6m
Total Distributions
Vehicle
Paid-in Capital
Gross TVPI
Net TVPI
DPI
Notes
MAF I (to transformation)
USD 26.1m
2.2x
2.0x
2.0x
LPs who exited in 2014
MAF I (to today)
USD 26.1m
2.9x
2.1x
1.0x
LPs who stayed in Maris Ltd
Maris Ltd
USD 57.2m
1.5x
1.1x
0.5x
New shareholders from 2014
Total
USD 83.3m
—
—
—
Paid-in (MAF I to today + Maris Ltd)
Capital Raised vs Distributions (USDm)
Top 8 Company Returns, MOIC
* Equator Energy shown on an equity basis. On an overall capital invested basis, the total capital return was c. 2.7x, with a net USD IRR of 36%.
All Maris documents in a single library - fund presentations, annual and quarterly reports, MAF I fund reports, and standalone E&S reports. Click any tile to open the PDF.
Maris Ltd Annual Reports, Quarterly Shareholder Reports, and standalone Environmental & Social Reports.
11 annual reports from 2014 to 2024.
42 quarterly shareholder reports, most recent first.
10 standalone E&S reports from 2015 to 2024.
17 MAF I quarterly fund reports from 2009 through 2014.
Fund presentation and 8 appendices. Click any row to open the PDF in a new tab.